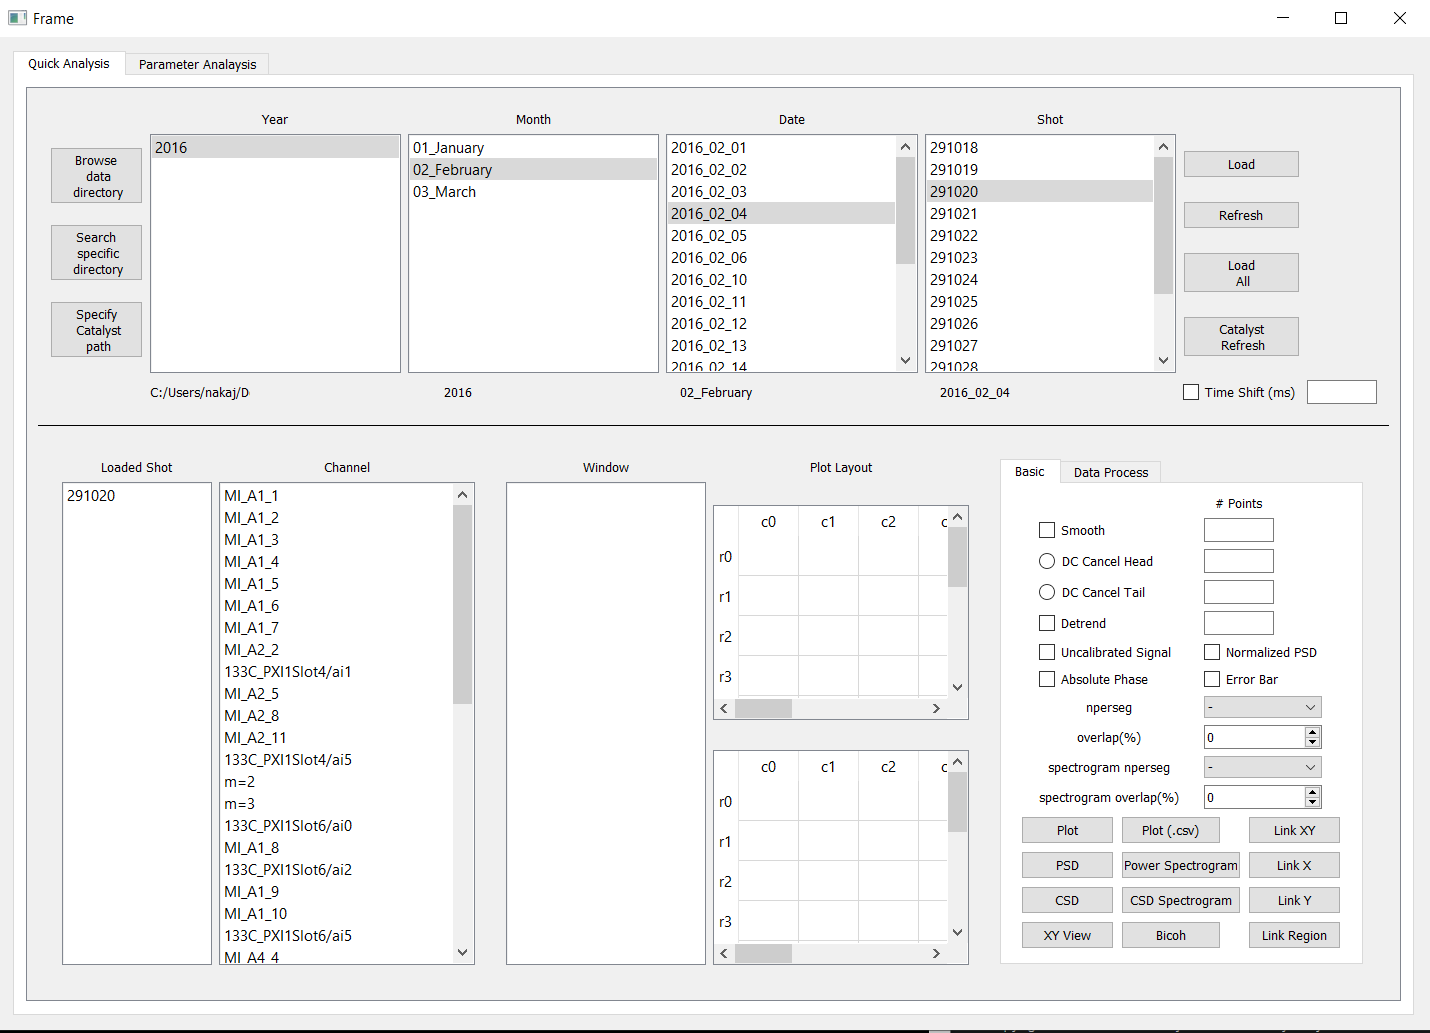
Data Visualization GUI
Interactive data analysis tool
Data Visualization GUI (GitHub)
This work came up during my M.Sc. work on experimental plasma physics. We were generating large amounts of measurement data, and we needed a way to quickly visualize and analyze the data. For this purpose, I developed a data visualization GUI using Python and PyQt5. The GUI is designed to be interactive, and it allows the user to quickly visualize the data and perform preliminary analysis such as plotting and spectral analysis. We published this work in a journal.
